Posts

About

Image
  This blog documents and explains World-System models from years 0-800 estimated from the Maddison Database (see the Boiler Plate here ). For the World System (you can run the code here ), the state variables explain over 99% of the variance in the underlying indicators. The first component state variable, WE1=(0.577 Q + 0.578 N - 0.577 T) , describes the Environmental Controller. The second component state variable, WE2= (0.528 Q + 0.274 N + 0.804 T) , describes overall growth. The third component state variable, WRE3 = (0.622 Q -0.769N) , describes the Malthusian Controller. Unlike models future Centuries, World-System countries in the Roman Empire period were predominantly controlled by Environmental forces. Growth is not the dominant component . Beyond that, societal development is controlled by Malthusian forces , The result would seem to be consistent with an environmental version of Unified Growth Theory . My working hypothesis is that when growth becomes the dominant compo...

World-System (0-500) Why Did Western Europe Collapse?

Image
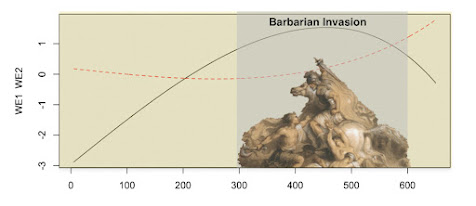
  In another post ( here ), I investigated the Decline and Fall of the Roman Empire .   It was clear from the  W_RE, EE_R and WE_RE state space   models (you can find and run  the computer code  here ) that the decline of Western Europe (and not morality or declining birth rates ) split the  Roman Empire  in two and made it ungovernable. But why did Western Europe Collapse? Actually, the collapse of Western Europe is an easy question to answer (with models) and it is somewhat of a conventional explanation for the Decline and Fall . From (300-600 AD), Western Europe was destabilized by plagues and  the migration, invasion, and settlement of various tribes, notably the  Burgundians ,  Vandals ,  Goths ,  Alemanni ,  Alans ,  Huns ,  early Slavs ,  Pannonian Avars ,  Bulgars  and  Magyars . The period is typically called the Barbarian Invasions . Notes The Measurement Model for the WE_RE ...

World-System (0-500) Why Did the Roman Empire Collapse?

Image
  The extent of the Roman Empire went from England in the North to Africa in the South (see the green shaded area in the graphic above). From a statistician's standpoint, it is the first point in time (0-500) when we start to get data on the World-System thanks to the work of Angus Maddison . As "every school boy knows," the Roman Empire declined during this period and eventually fell . The historiography of the period, primarily qualitative, has given plenty of room for pseudo-intellectual speculation. The two most prominent current right-wing pseudo-intellectuals to use the Collapse of the Roman Empire for their own purposes are Steven Bannon and Elon Musk  (a recent discussion of their positions can be found here ).  The two culprits in the decline and fall scenario are declining morals (Steve Bannon) and declining birthrates (Elon Musk). These supposed lessons of history  are being used by the MAGA movement and the Trump Administration  to justify pronata...

Boiler Plate

Image
  State Space Model Estimation The Measurement Matrix for the  state space models  was constructed using  Principal Components Analysis  with  standardized  data from the  World Development Indicators . The statistical analysis was conducted in an extension of the  dse package . The package is currently supported by an online portal ( here ) and can be downloaded, with the R-programming language, for any personal computer  here .  Code for the state space  Dynamic Component models (DCMs)  is available on my Google drive ( here ) and referenced in each post. Atlanta Fed Economy Now My approach to forecasting is similar to the  EconomyNow model used by the Atlanta Federal Reserve . Since the new Republican Administration is signaling that they would like to eliminate the Federal Reserve, the app might well not be available in the future. While the app is still available, there have been some interesting development...